Eversify Reader Data Visualization
THE CHALLENGE
In order to provide an analytics tool that could be sold to customers, we needed to deliver compelling information in new and interesting ways. The existing reader stats provided basic information, like the number of downloads. We needed to expand this, in order to find data that the customers could really use.
THE PROCESS
Working together with the project manager and other stakeholders, I collected user scenarios to determine what types of information would be most useful. These were broken down into a few main categories:
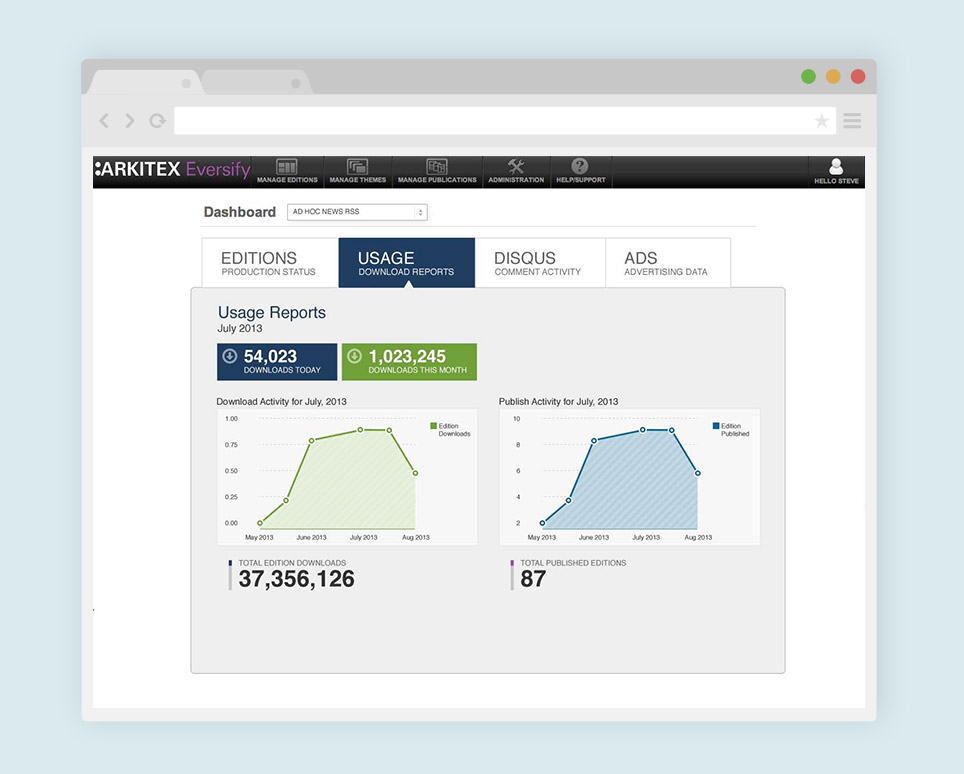
- Publication Data. This is where the user could find information about the editions and articles themselves. Which articles were most popular, what days were most popular?
- Comment Activity. Which articles were generating the most interactions from end users?
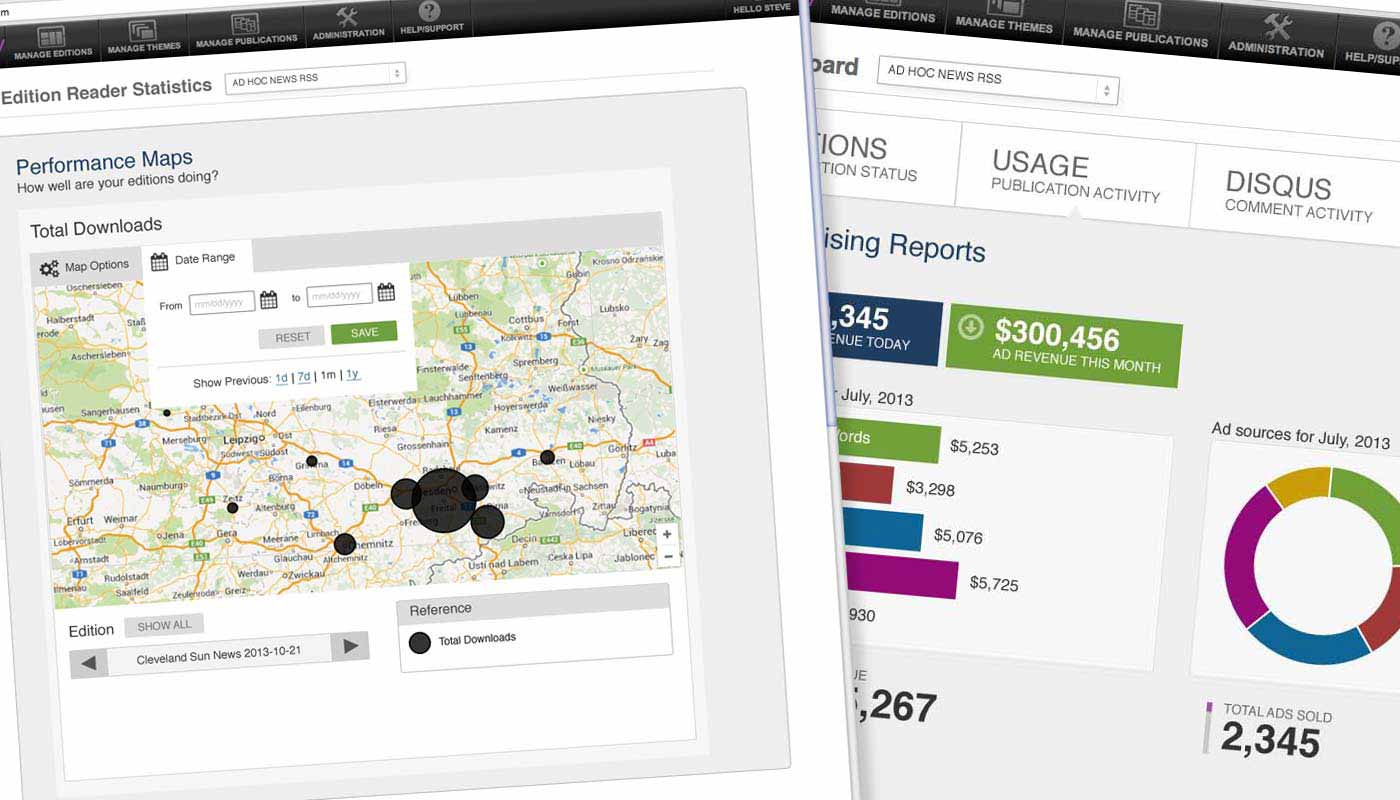
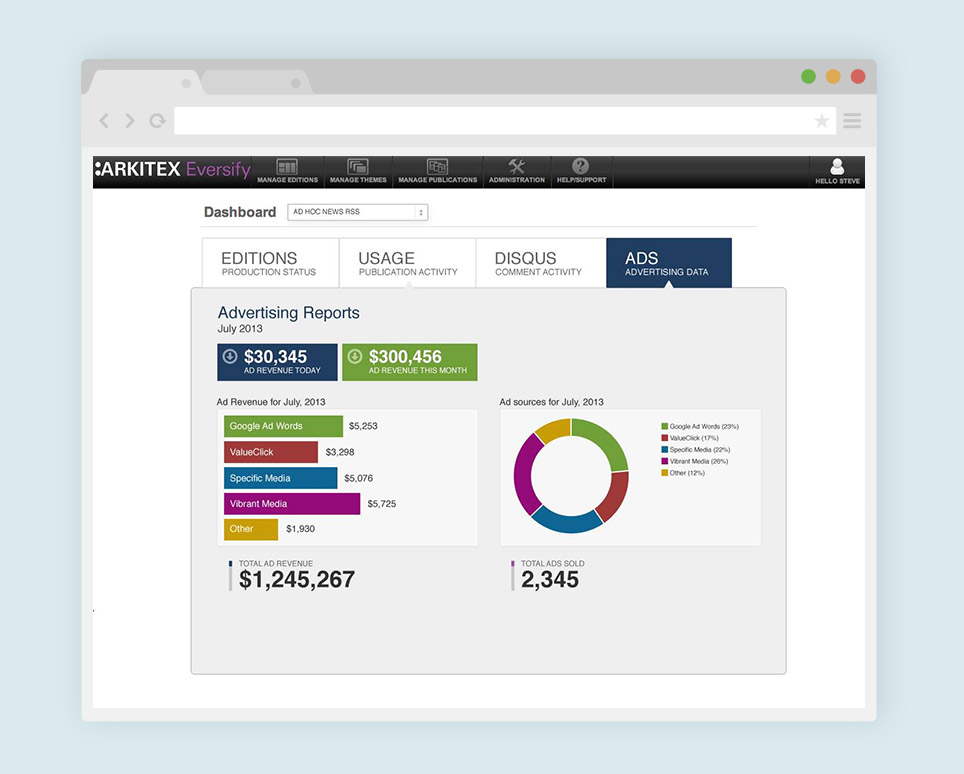
- Advertising. Tracking the performance of each ad.
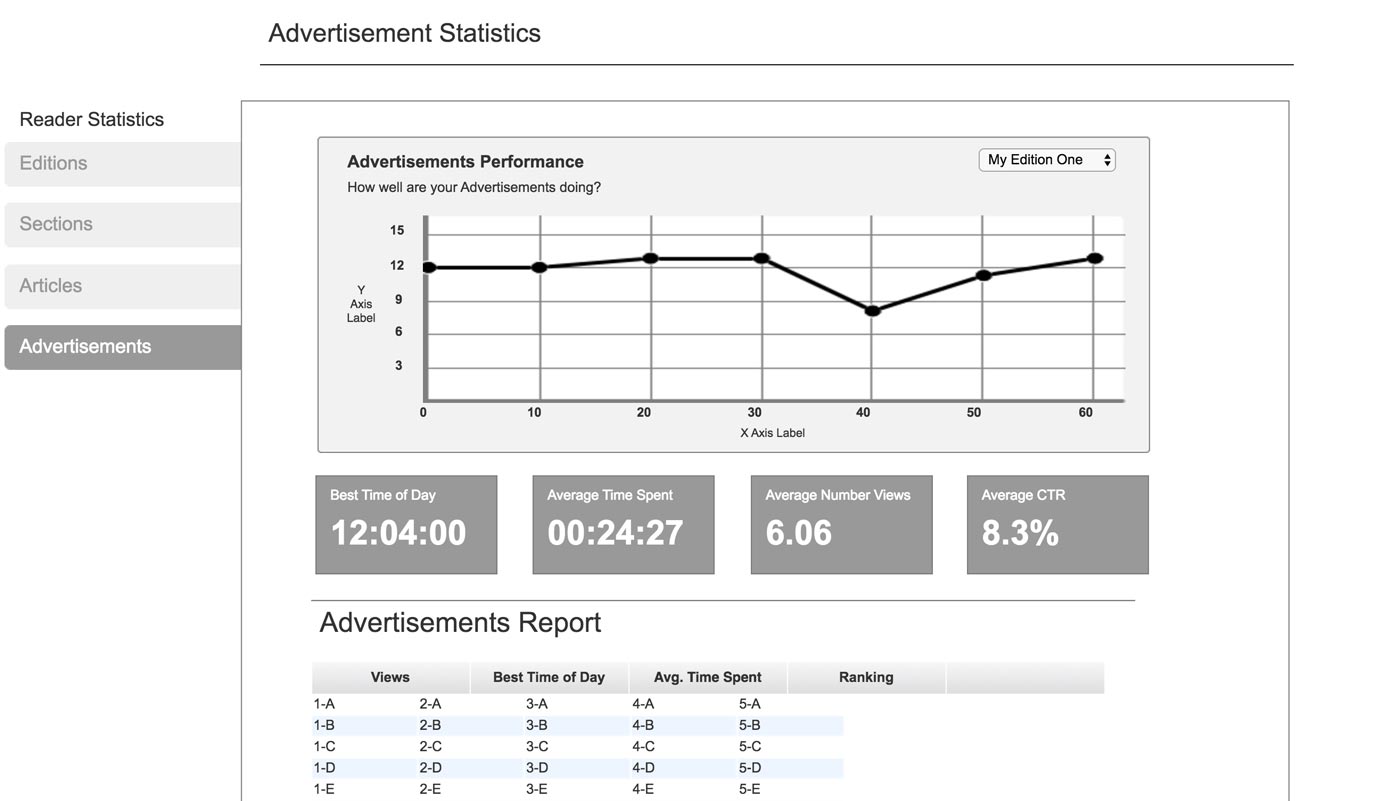
After defining the key areas that we wanted to present, I began exploring ways to present the information. Shown here are the early wireframes, which progressed through iterations into the much more complex designs shown below.
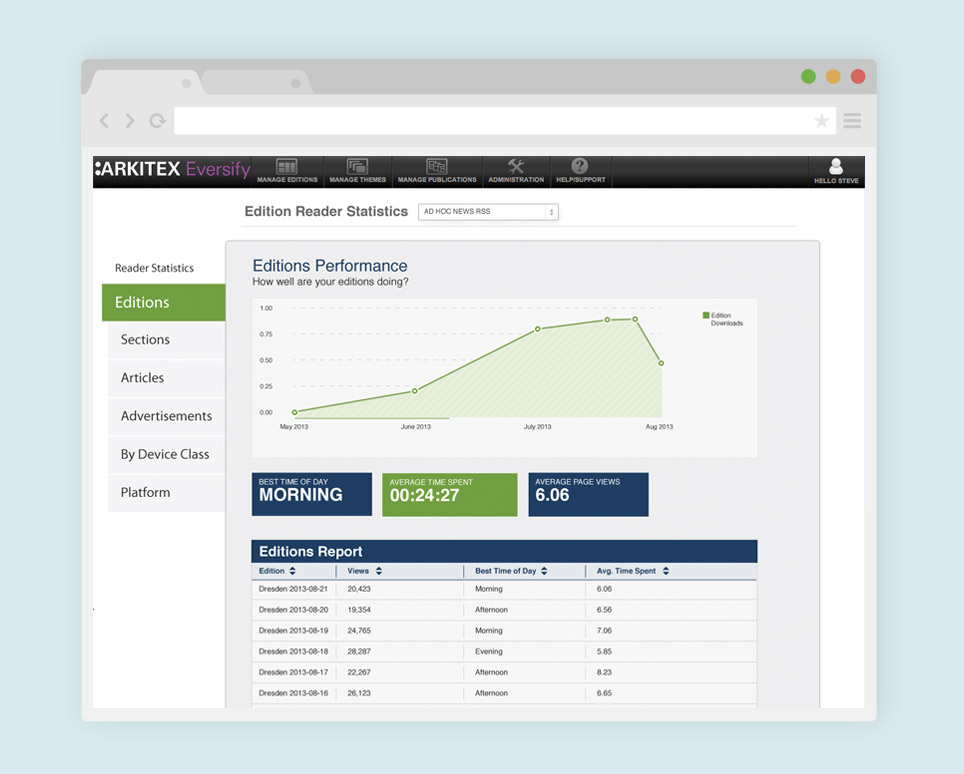
When we had worked out behaviors and key elements in the wireframes, I began mocking the screens up in Photoshop, emphasizing clean and clear visualizations of the available data. The customer could have control over certain types of data, and choose the type of chart they would prefer to read them in. These user preferences would be stored when they returned.
Reader Stats
The basic reader stats provided a simple overview of data in a quick, accessible way.
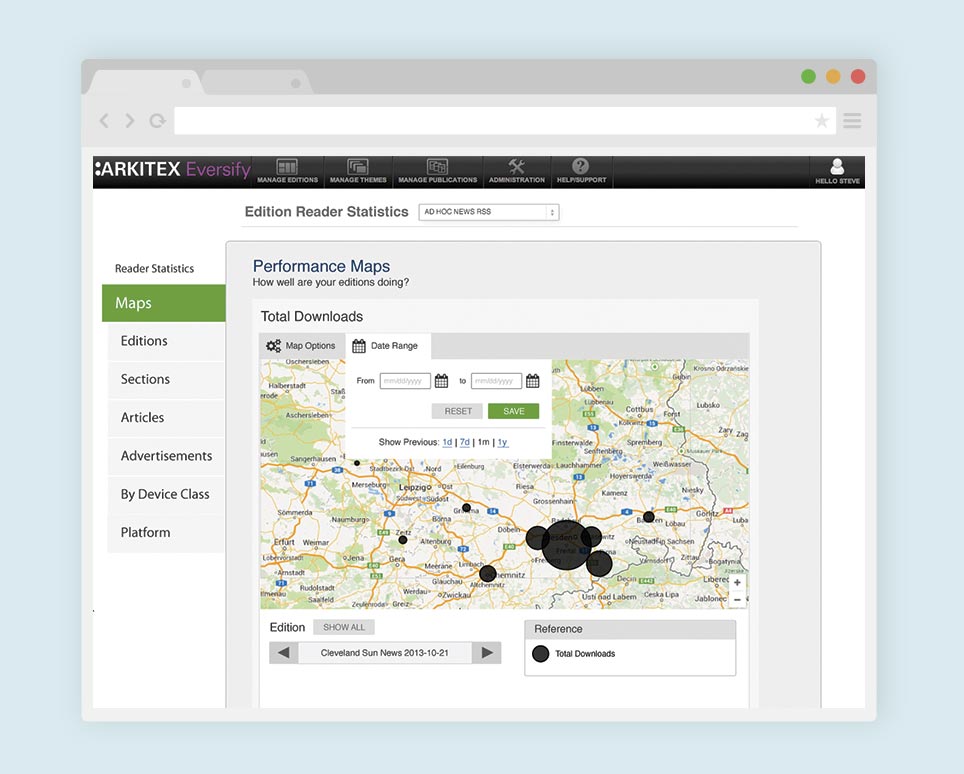
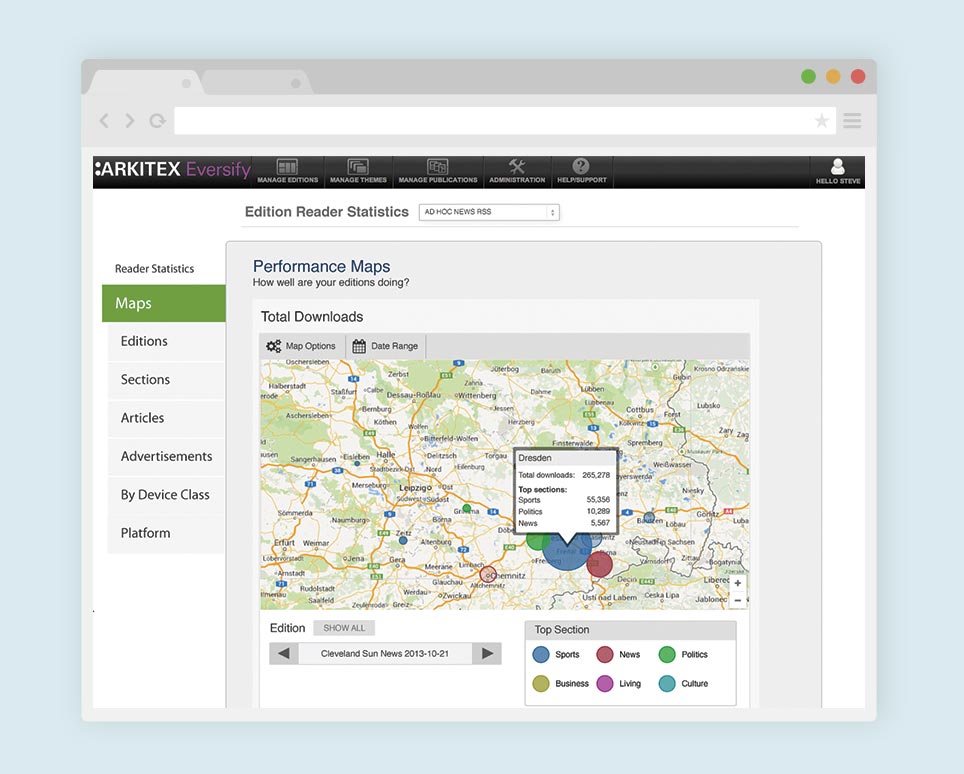
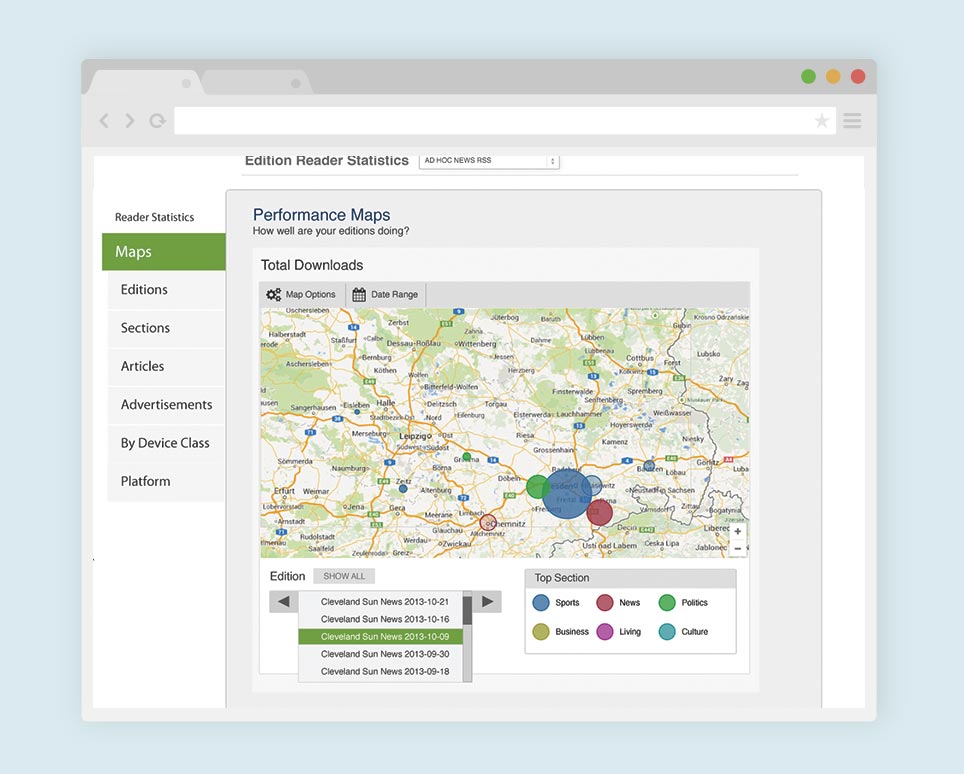
Deep Analytics
In addition to basic stats, the design called for deeper information, that the publisher could drill down into. Heat maps would represent popular areas on a map. Users could show section performance and see which sections performed the best in different locations. The user could filter by particular editions and see a summary of how many users opened a particular section.